


Patient Resources
Tools You Can Use
Weight Loss Graphs
Graphing your weight loss is one of the most important tools you can use on your journey! We provide you with two versions of our popular weight graph.
You can't drive a car if you can't see where you're going. You can't control your weight if you can't see where it's going. An important weight control technique is to keep a visual record of your weight.
Start by printing one of our blank weight graphs below (click on the image). We are providing you with two weight graph options. If you are intending to lose weight (versus maintaining weight), you will want to use the weight loss phase graph. If you've lost weight and are ready to enter the weight maintenance phase, you will want to use the long-term phase graph. Both graphs are provided in PDF format and instructions on how to keep a weight graph are included below.
Weight Graph: Weight Loss Phase
(Click image below for a downloadable Weight Graph PDF)
Weight Graph: Long-Term Phase
Beginning now, weigh yourself consistently, preferably every day, and record each weight on your weight graph, regardless of which graph you're using. Some people prefer to weigh only once per week; there is evidence that weighing daily is best, but the most important thing is that you weigh yourself consistently and at least weekly, even if you think your weight will be up. Read on for instructions on proper weighing and how to track your weight on your weight graph, both during the weight loss phase and for long-term weight maintenance.
How to Weigh
Get a good scale. Get on and off it at least three times to see that it gives a consistent reading. Put it on a level, hard surface at home. Don't worry if your scale shows a weight different from other scales. You are only interested in change.
Weigh at the same time under the same conditions every day. Most of us are lighter immediately after voiding when we get up in the morning. The bottom horizontal line shows the days of the month. The left vertical line will show a range of your weights. Write in your first weight next to the third line from the top. List successive weights up and down from there, one pound per line, higher weights at the top.
Each day, go up the line above that day until you are on the same horizontal line as your weight that day, and make a dot. Connect the dots with a solid line. The example below shows someone who started graphing on the 10th of the month at 178 lbs, weighed 178.5 on the 11th, 177 on the 12th, 177 on the 13th, 177.5 on the 14th, 177 on the 15th, 176 on the 16th, etc.
Sample Graph
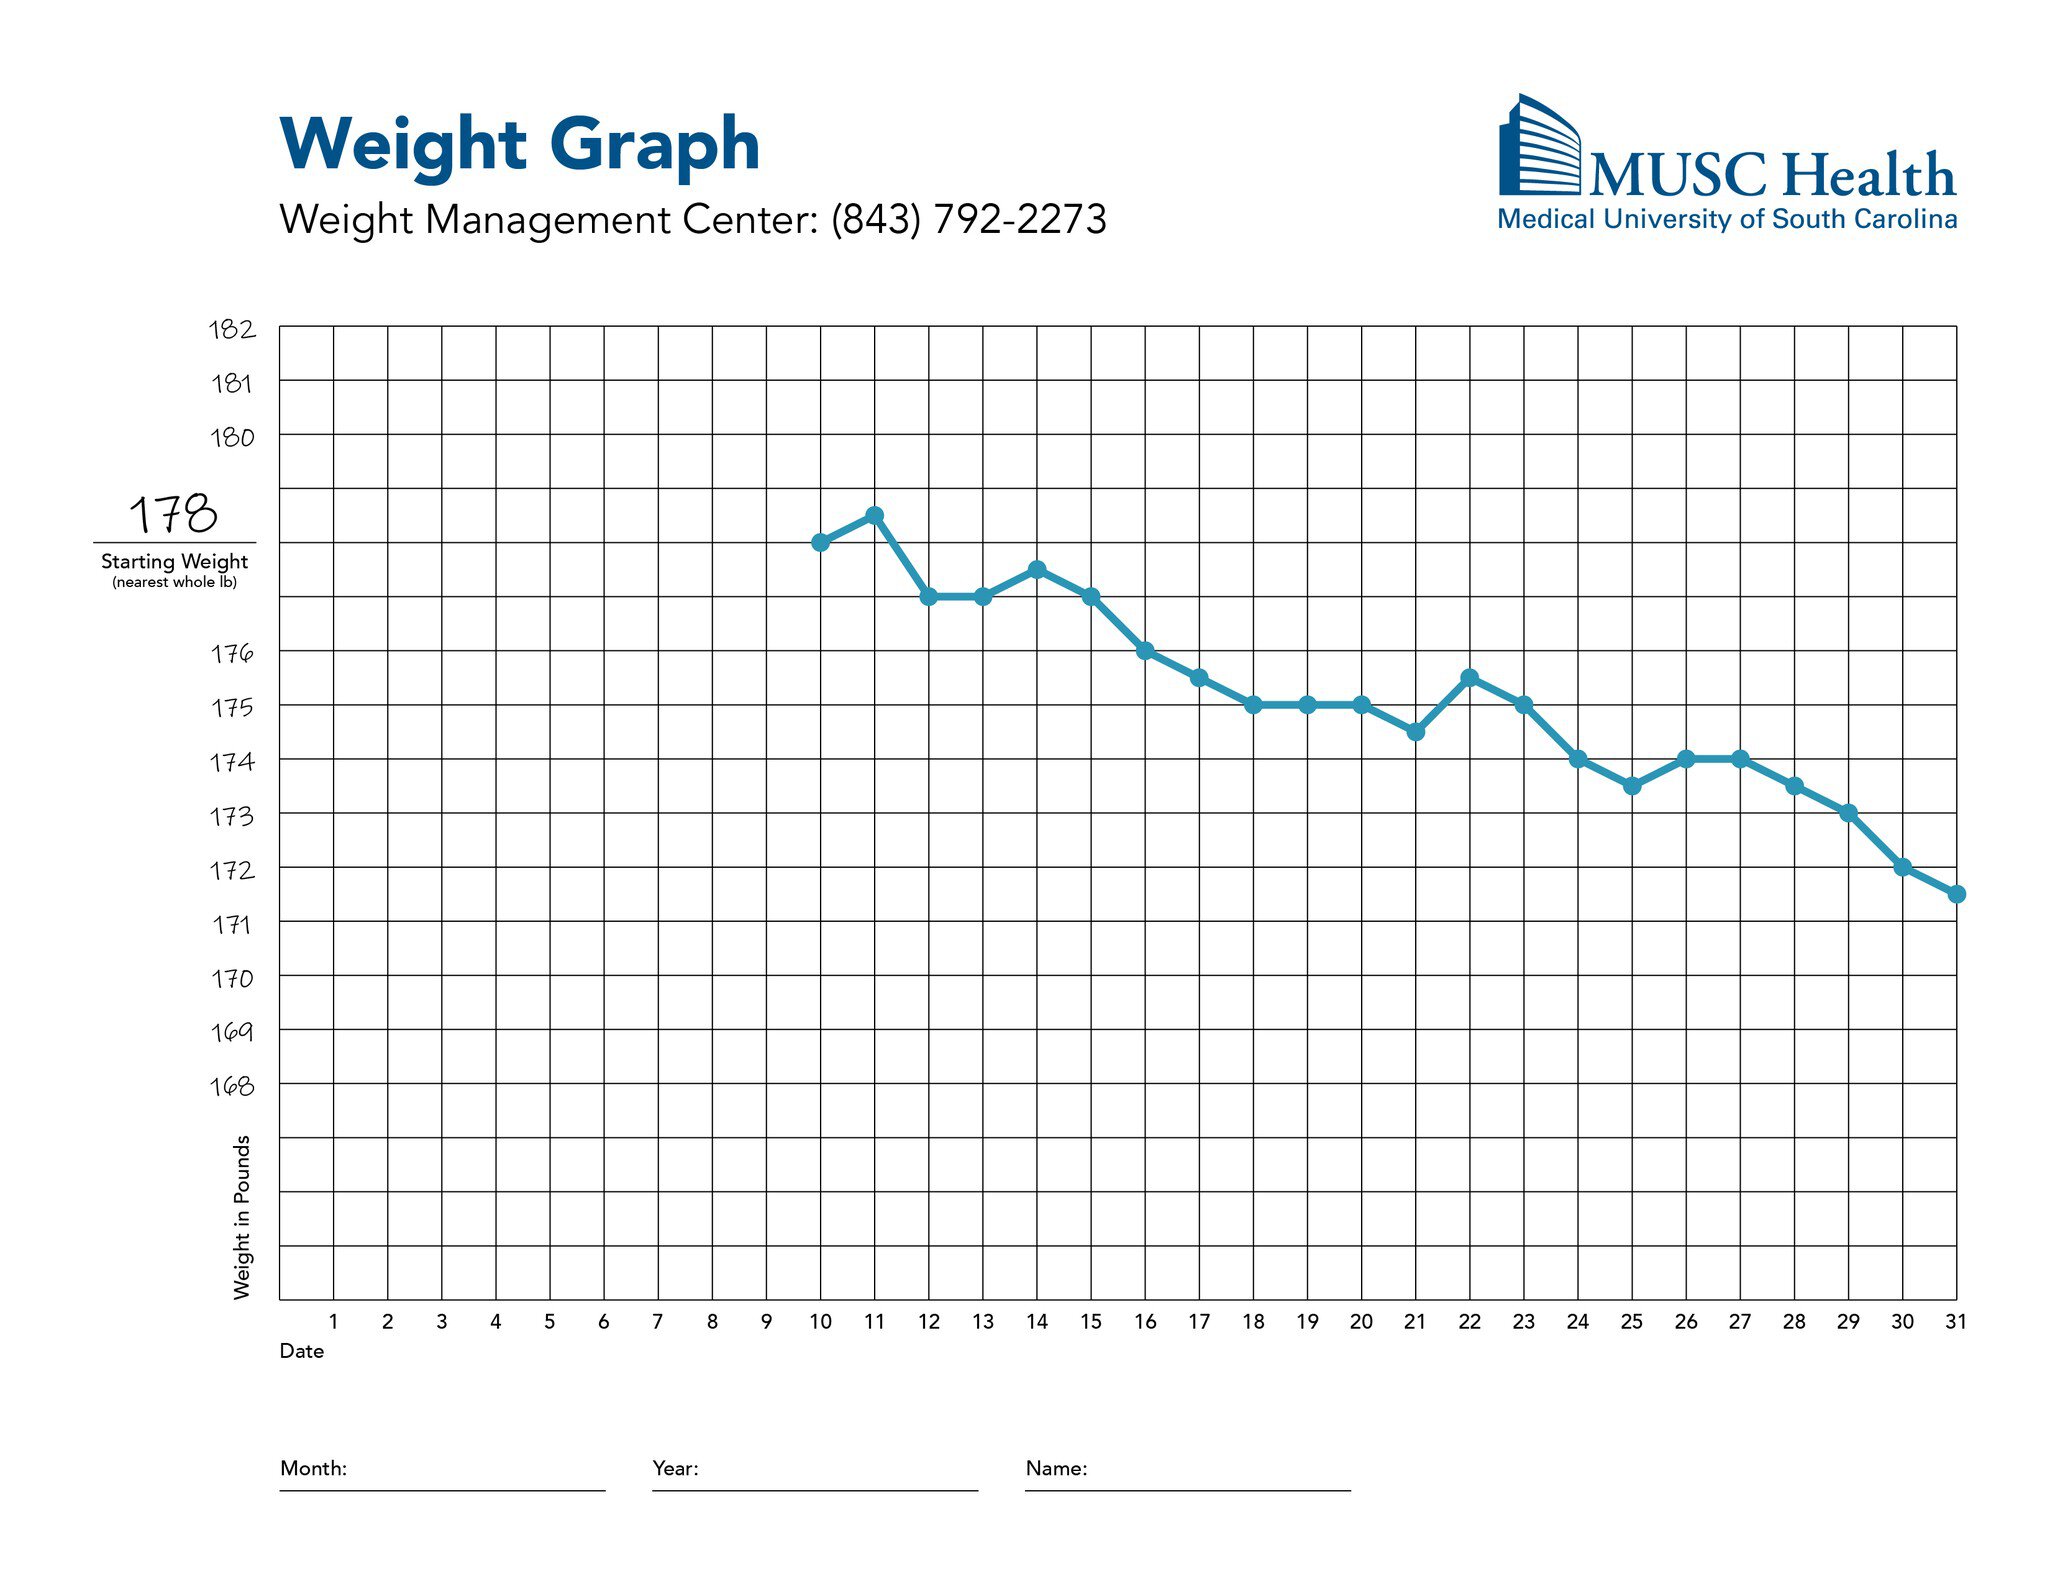
The beginning of a weight loss effort is when weight graphing is most fun, a good time to start the habit. At any time though, your graph will show ups and downs because of changes in fluid balance, differences in fluid intake from day to day, level of physical activity, and weight of undigested food. You will learn to understand these variations and use the overall trend to guide your weight control plan. The individual data points are just to show you your trend.
Remember, today’s weight is an important bit of information, but not an indication of the success of yesterday’s weight control efforts. Fat weight changes much more slowly than does water weight, so water weight changes will overshadow fat changes on a daily or even weekly basis. Your weight may go down the day after you overeat, or up the day after your diet and exercise were perfect.
In the long run, graphing can be the single most important part of your weight control efforts. It will show you whether you’re heading in the direction you wish. It only takes about 10 seconds. If you weigh and graph consistently for the rest of your life, you will be more successful at long-term weight management.
Long-Term Weight Maintenance
(Click the image below for a downloadable Long-Term Weight Maintenance PDF)
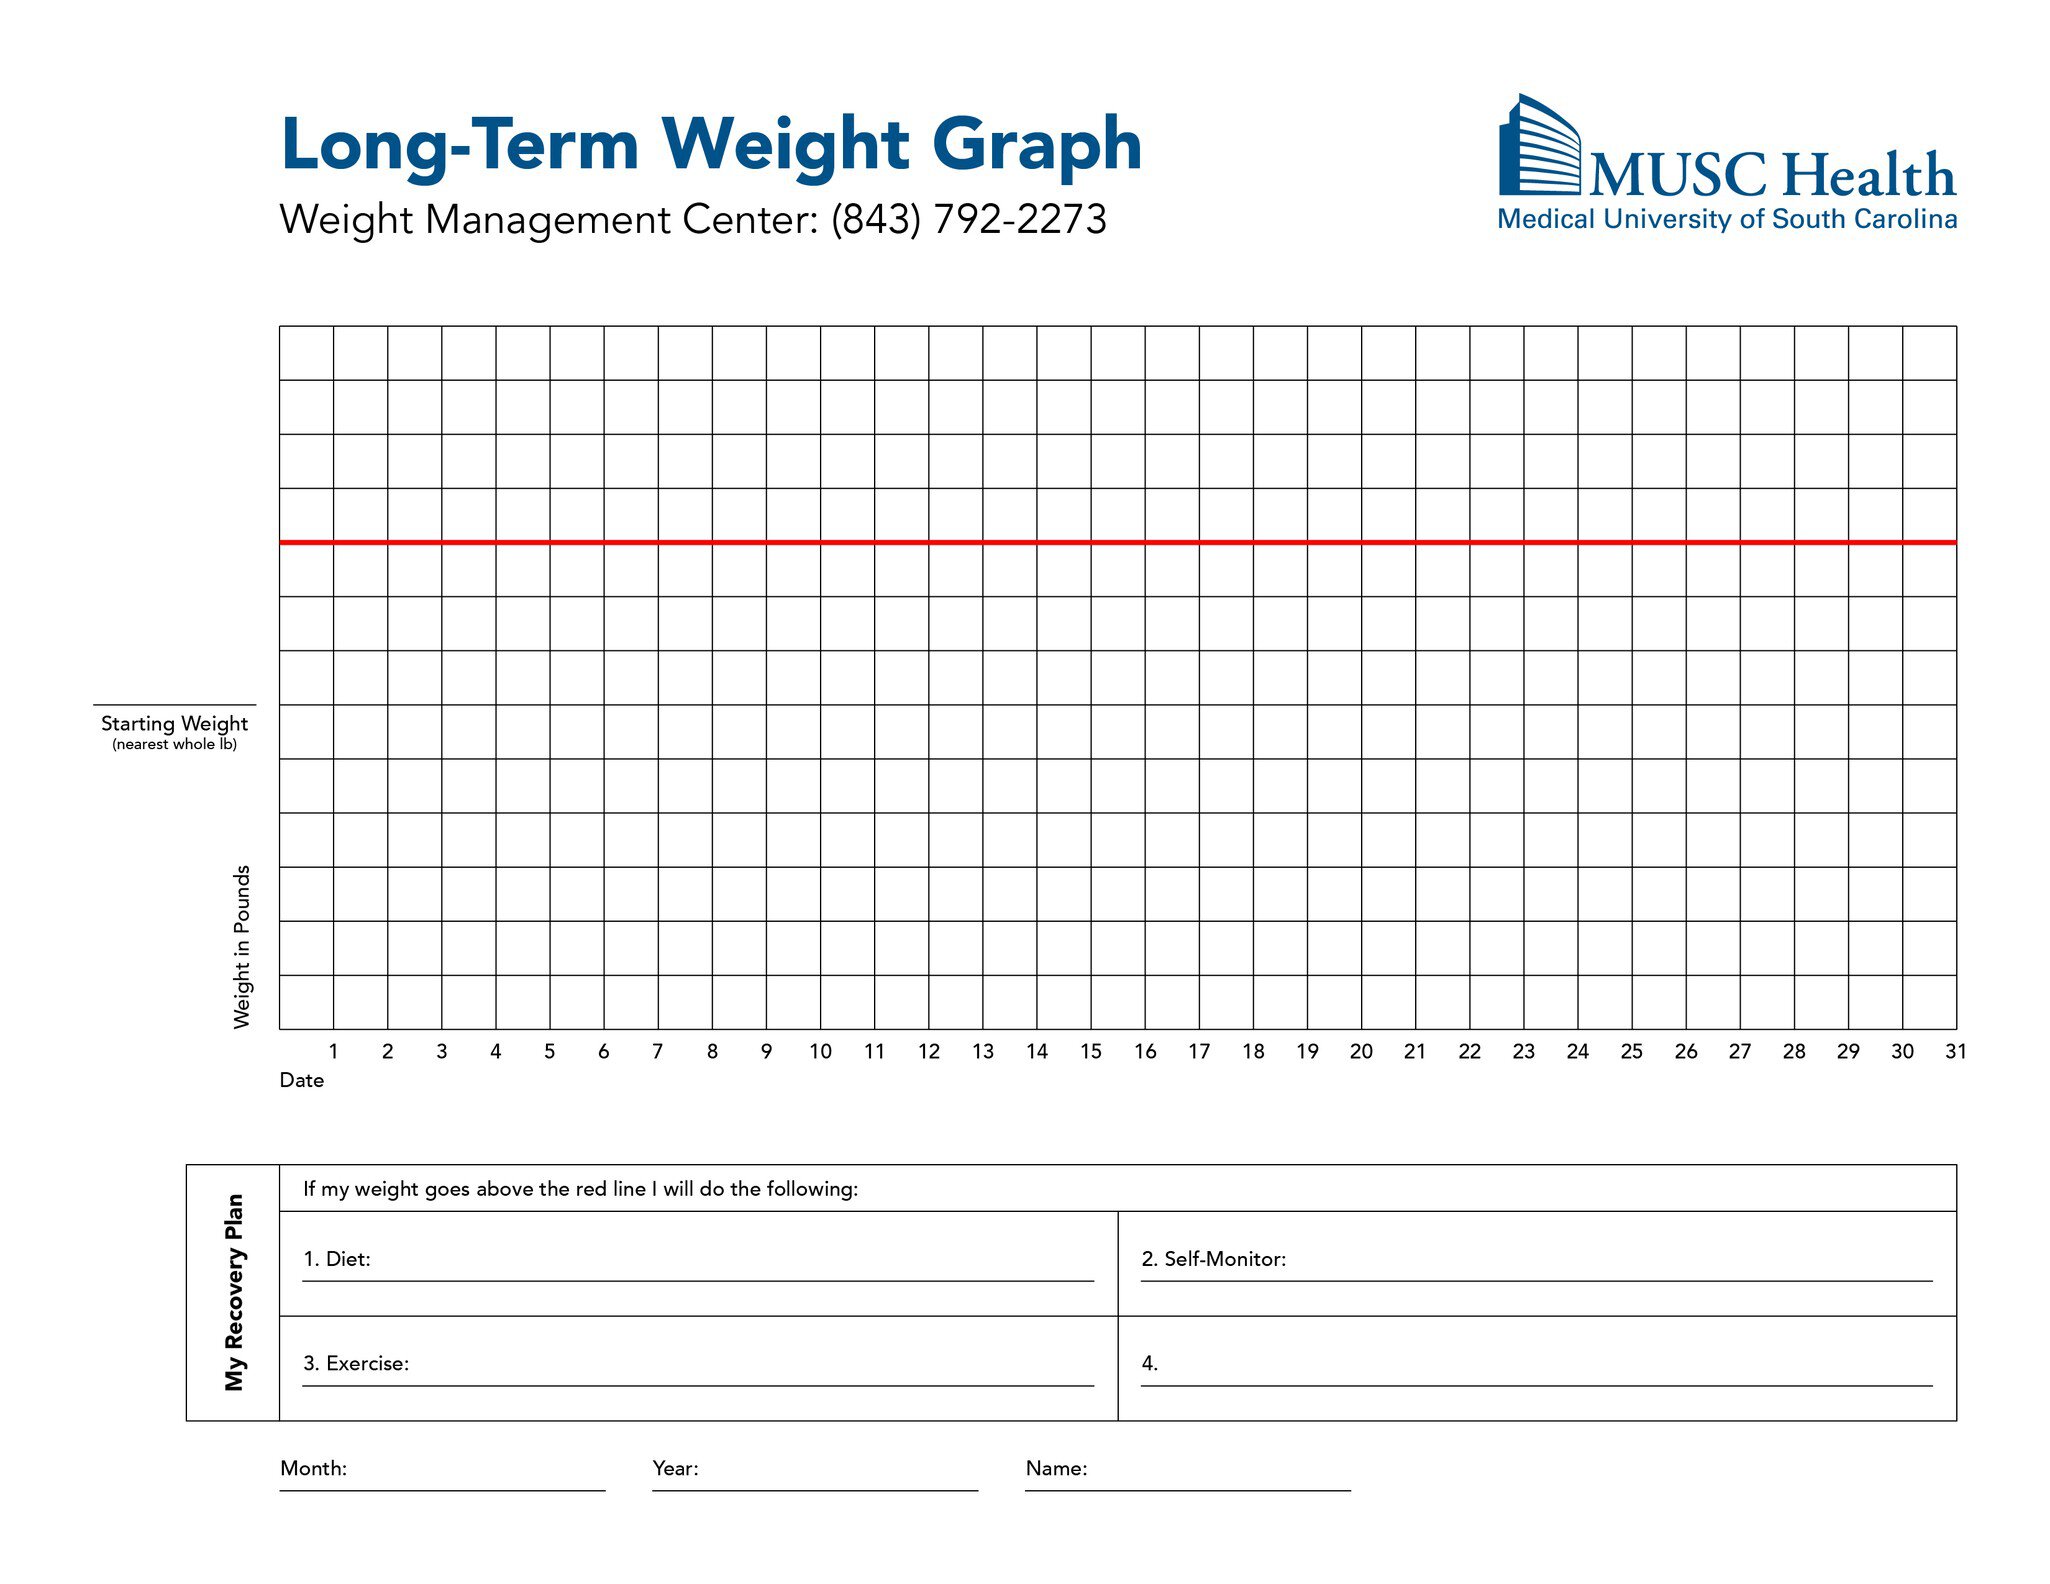
Successful long-term weight control has two phases: Losing the weight and keeping it off. There’s not always a clear dividing line between the two. However, sooner or later you will either arrive at your goal weight or realize that the initial phase of easier, steadier loss is over. This is when you should switch to our Long‐term Weight Graph…the one you’ll use for the rest of your life!
During this "forever" phase, it’s natural that you won’t devote as much time, thought, and energy to the effort as you may have done initially. The purpose of the Long‐term Weight Graph is to help you to continue to monitor your weight, while keeping yourself honest and setting up a plan to correct any unwanted weight gain.
That’s where the red line comes in. It’s the trigger for your personal "recovery plan." At the beginning of each month, put your current weight about 3 pounds below the red line (more if your normal fluctuations exceed 3 pounds).
What do you do if your weight hits the red line? Plan ahead. Identify 3 to 4 specific goals, including dietary, exercise, and self-monitoring goals that you will carry out if your weight reaches the red line this month. Keep that plan working until your weight is again safely below the red line.
Here is an example recovery plan:
- Dietary: follow the food plan and eat every 2 to 4 hours
- Exercise: walk at least 5 days a week for a total of 200 minutes per week
- Self-Monitor: monitor and record all food and exercise in your food diary
- Keep a thought record and work on eliminating "all-or-none" thinking
Long-term weight control is sometimes easy, sometimes not so easy. If you're having trouble maintaining your weight loss, please do not hesitate to call us at 843-792-2273 or email us at WMC@musc.edu.
Track Your Intake
We show you how to keep track of what you're eating using a food diary.
How to Keep a Weight Management Diary
Start by printing a blank Weight Management Diary. Below, we have provided the diary in PDF format, as well as instructions on how to keep a diary of your dietary intake.
Recording your intake is a powerful weight management tool. By recording you can identify patterns and problems that lead to overeating and weight gain. Keeping an eating diary can assist in locating problem areas and identify where specific changes can be made to deal with them. Most important, keeping an eating diary shows you how much you are actually consuming.
Weight Management Diary Instructions
It is best to record your intake at the time of consumption or as soon as possible thereafter. Waiting until the end of the day to record may cause you to forget some items that may make a meaningful difference in your weight. Plus, if you’re trying to keep to a certain calorie level, you won’t know how you’re doing until the end of the day, when it’s too late to change your intake for that day.
Time: Record when you eat, rounding off to the nearest 15 minutes. Include a.m. or p.m. This will allow you to see if you tend to overeat at certain times of the day or when you’ve gone too long without eating. The WMC recommends eating a meal or snack every 2 to 4 hours, trying to avoid going more than 4 hours between meals and snacks.
Food and Amount: Record everything you consume. Include all beverages that contain calories, as well as condiments (mayonnaise, etc.). Err on the side of over-reporting. Remember, every bite counts, so log everything.
It is important to also indicate the amount of each item you are consuming. The most accurate way to do this is by actually weighing or measuring the food items you are consuming with measuring cups and food scales. For instance, an apple may be small, medium or large; ice cream may be measured in cups; meat in ounces; and a soda in fluid ounces.
Exchanges/Calories: This column can be used to tally exchange servings or calories. Our WMC patients have been educated on exchanges and track these each day, but many of you are more familiar with calories. Recording exchanges or calories in this column is strongly encouraged so you can keep track of your intake; however, if you don’t have access to exchange/calorie information at the time of your meal/snack, still record the food and amount, filling in the exchanges/calories later. Note, you can keep a running tally of your exchanges in the boxes at the top of each day’s diary.
Exercise and Duration: Tracking physical activity is another way to monitor progress with weight management. Write down any physical activity above and beyond your normal lifestyle activity along with the minutes. If you wear a pedometer, make sure to log your steps taken everyday.
Weighed and Graphed: Weighing yourself and graphing your weight daily is another tool that has been shown to help you manage your weight. Tracking your weight on one of our weight graphs will give you an accurate picture of your weight trends over time. Please keep in mind that multiple factors affect your weight, so today’s weight doesn’t necessarily indicate whether you did a good job yesterday…however, yesterday’s food diary does.
Weight Management Newsletter
If you would like to subscribe to our newsletter, simply provide us with the following information below. Your name and address will never be shared with entities outside MUSC, and you may unsubscribe at any time. Our newsletter is sent out the first week of each month.
Unsubscribe From Our Newsletter
If you would like to unsubscribe from our newsletter, please provide us with the information below. We greatly appreciate any and all feedback regarding our newsletter. You may also restart your subscription at any time.
